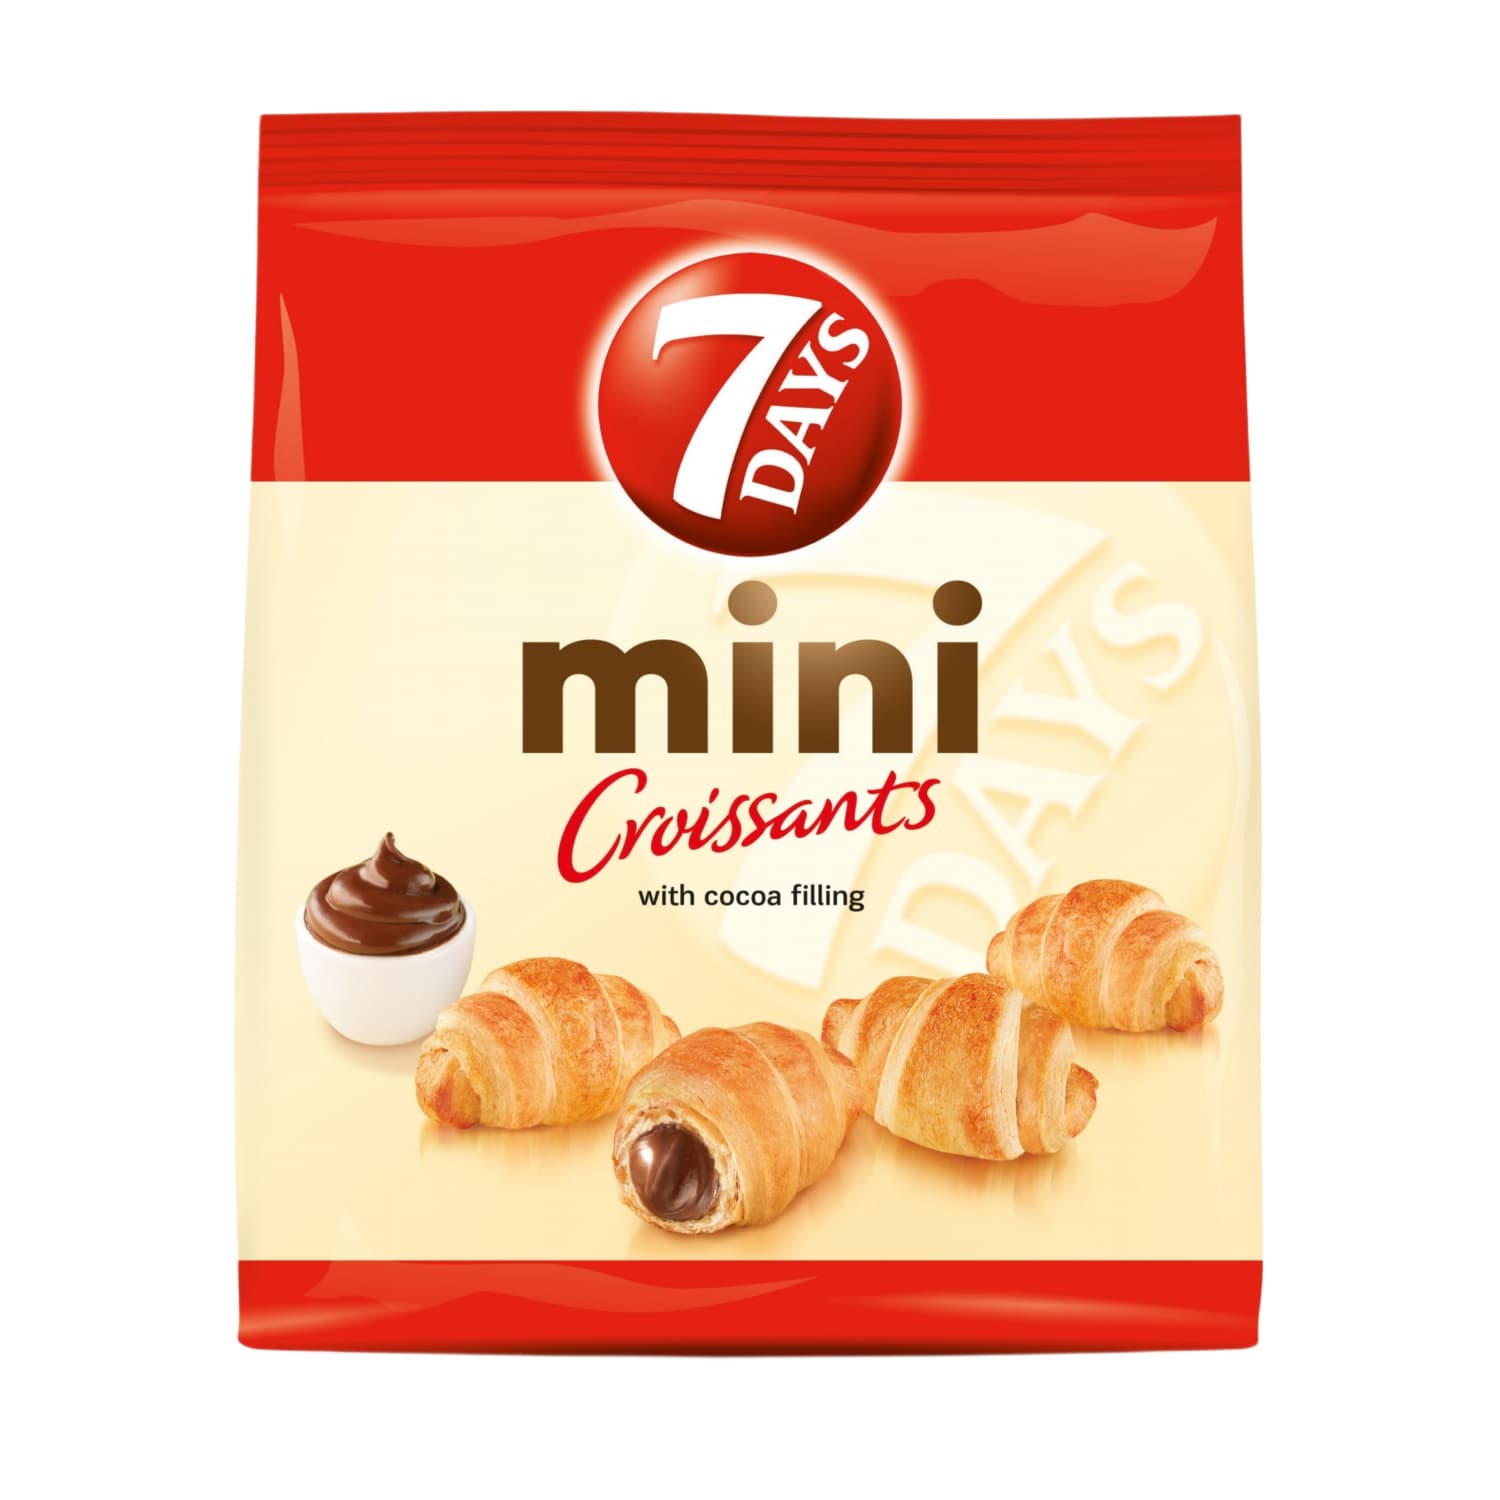
Croissants with cocoa filling 7 DAYS MINI, 185g
Healthier picks of the same kind
 Cake with Candied Orange Peel, 260 g
381 kcal · 100 g
15% fewer kcal
less saturated fat
Compare →
C
43
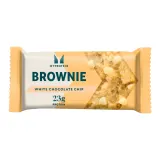 White cake with white chocolate MYPROTEIN, 75 g
379 kcal · 100 g
15% fewer kcal
less saturated fat
Compare →
D
39
 Lemon cake SCHAR gluten-free, 250 g
426 kcal · 100 g
less saturated fat
more fruit & veg
Compare →
D
39

| Nutrient | 100 g | 185 g |
|---|---|---|
| Energy | 1871 kJ/ 448 kcal |
829 kcal
41% RI
|
| Fat | 28 g |
52 g
74% RI
|
| of which saturates | 13 g |
24 g
120% RI
|
| Carbohydrate | 46 g |
85 g
33% RI
|
| of which sugars | 19 g |
35 g
39% RI
|
| Protein | 6 g |
11 g
22% RI
|
| Salt | 0.6 g |
1.1 g
19% RI
|
RI – reference intake for an adult (2000 kcal).
From the product label · updated 2026-10
- Salt −2
- Sugars −5
- Energy −5
- Saturates −10
- Protein +2
How this is worked out
We use the Nutri-Score method: points for energy, sugar, saturated fat and salt, less points for protein, fibre and fruit and vegetable content. Drinks, oils and cheese are judged on their own scales — otherwise olive oil would look worse than a sugary drink purely for being calorie-dense.
Shops do not publish fibre, so we treat it as zero. Whole grain and pulse products may therefore score slightly lower here than the label on the packet says.
18 ingredients · 8 additives
Tap an ingredient to see every product that contains it.
Common questions
- How many calories are in Croissants with cocoa filling 7 DAYS MINI, 185g?
- 100 g – 448 kcal. 1 pack (185 g) ≈ 829 kcal.
- How much protein, fat and carbohydrate?
- Per 100 g: protein 6 g, fat 28 g, carbohydrate 46 g.
- Is Croissants with cocoa filling 7 DAYS MINI, 185g a healthy choice?
- Health grade E (0 of 100), from its sugar, saturated fat, salt, fibre and protein.
Added by a community member · 2026-07-19
Follow stebi.me
Label facts, in your feed every day
Where the sugar hides, which has the most protein, which yogurt is better – short comparisons worth saving.